


Jupiter
Thanks to all the agenicies that have shared these wonderful pictures of Jupiter...
Sources
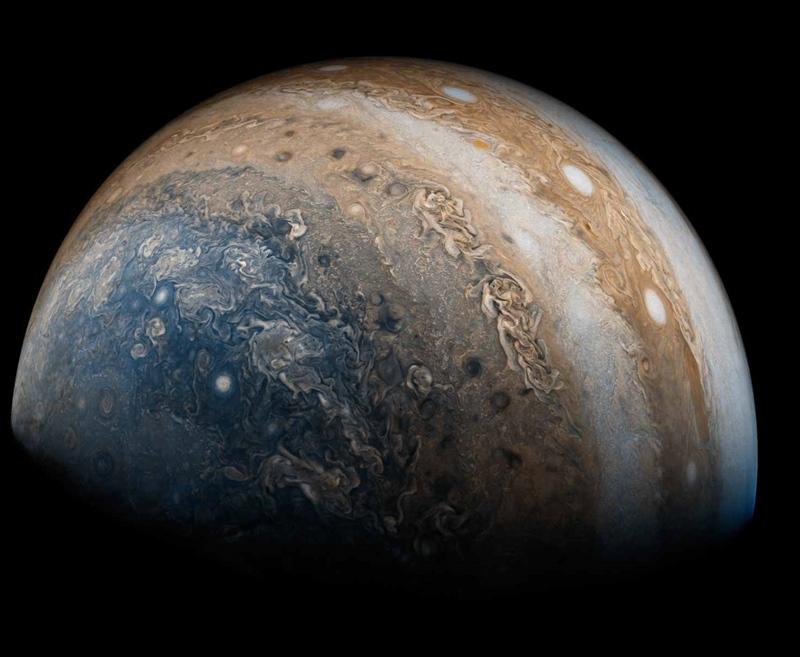
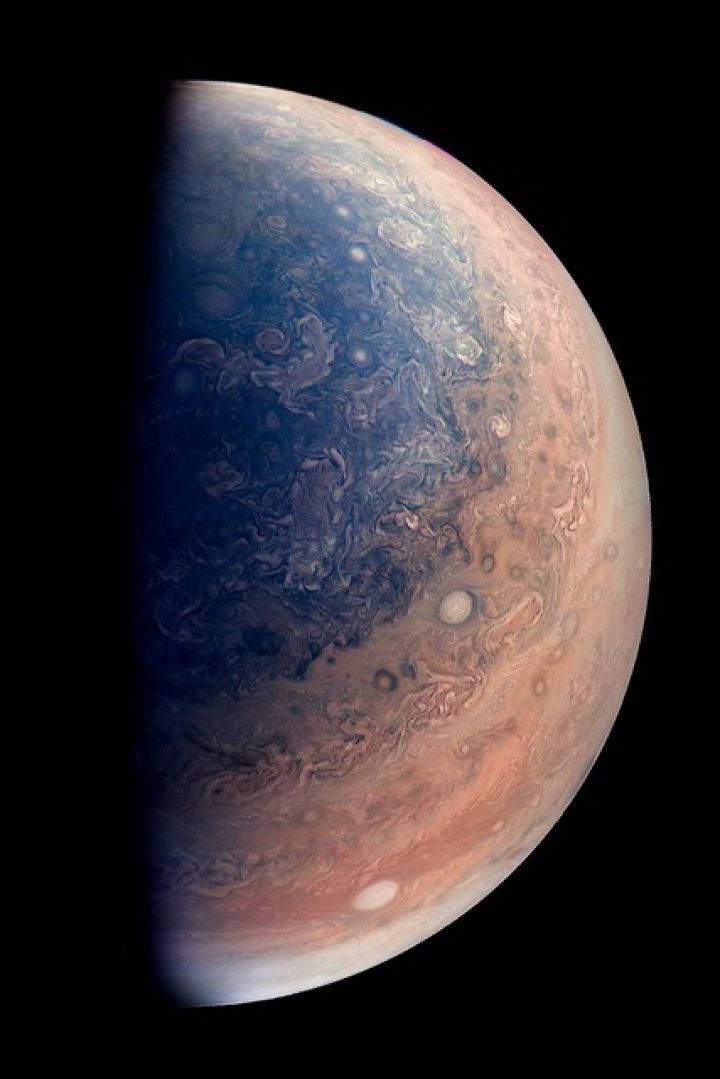
This true color mosaic of Jupiter was
constructed from images taken by the narrow angle camera onboard NASA's Cassini
spacecraft on December 29, 2000, during its closest approach to the giant planet
at a distance of approximately 10 million kilometers (6.2 million miles). It is
the most detailed global color portrait of Jupiter ever produced; the smallest
visible features are approximately 60 kilometers (37 miles) across. The mosaic
is composed of 27 images: nine images were required to cover the entire planet
in a tic-tac-toe pattern, and each of those locations was imaged in red, green,
and blue to provide true color. Although Cassini's camera can see more colors
than humans can, Jupiter's colors in this new view look very close to the way
the human eye would see them. Everything visible on the planet is a cloud. The
parallel reddish-brown and white bands, the white ovals, and the large Great Red
Spot persist over many years despite the intense turbulence visible in the
atmosphere. The most energetic features are the small, bright clouds to the left
of the Great Red Spot and in similar locations in the northern half of the
planet. These clouds grow and disappear over a few days and generate lightning.
Streaks form as clouds are sheared apart by Jupiter's intense jet streams that
run parallel to the colored bands. The prominent dark band in the northern half
of the planet is the location of Jupiter's fastest jet stream, with eastward
winds of 480 kilometers (300 miles) per hour. Jupiter's diameter is eleven times
that of Earth, so the smallest storms on this mosaic are comparable in size to
the largest hurricanes on Earth. Unlike Earth, where only water condenses to
form clouds, Jupiter's clouds are made of ammonia, hydrogen sulfide, and water.
The updrafts and downdrafts bring different mixtures of these substances up from
below, leading to clouds at different heights. The brown and orange colors may
be due to trace chemicals dredged up from deeper levels of the atmosphere, or
they may be byproducts of chemical reactions driven by ultraviolet light from
the Sun. Bluish areas, such as the small features just north and south of the
equator, are areas of reduced cloud cover, where one can see deeper. For more
information, see the Cassini Project home page, http://saturn.jpl.nasa.gov and
the Cassini imaging team home page, http://ciclops.org. The imaging team is
based at the Space Science Institute, Boulder, Colo. A high-resolution TIFF
version of this image is available at http://photojournal.jpl.nasa.gov/catalog/PIA04866.
*Image Credit*: NASA/JPL/Space Science Institute
This image taken by NASA's Cassini spacecraft on Dec. 1, 2000, shows details of
Jupiter's Great Red Spot and other features that were not visible in images
taken earlier, when Cassini was farther from Jupiter. The picture is a color
composite, with enhanced contrast, taken from a distance of 28.6 million
kilometers (17.8 million miles). It has a resolution of 170 kilometers (106
miles) per pixel. Jupiter's closest large moon, Io, is visible at left. The
edges of the Red Spot are cloudier with ammonia haze than the spot's center is.
The filamentary structure in the center appears to spiral outward toward the
edge. NASA's Galileo spacecraft has previously observed the outer edges of the
Red Spot to be rotating rapidly counterclockwise, while the inner portion was
rotating weakly in the opposite direction. Whether the same is true now will be
answered as Cassini gets closer to Jupiter and interior cloud features become
sharper. Cassini will make its closest approach to Jupiter, at a distance of
about 10 million kilometers (6 million miles), on Dec. 30, 2000. The Red Spot
region has changed in one notable way over the years: In images from NASA's
Voyager and Galileo spacecraft, the area surrounding the Red Spot is dark,
indicating relatively cloud-free conditions. Now, some bright white ammonia
clouds have filled in the clearings. This appears to be part of a general
brightening of Jupiter's cloud features during the past two decades. Jupiter has
four large moons and an array of tiny ones. In this picture, Io is visible. The
white and reddish colors on Io's surface are due to the presence of different
sulfurous materials while the black areas are due to silicate rocks. Like the
other large moons, Io always keeps the same hemisphere facing Jupiter, called
the sub-Jupiter hemisphere. The opposite side, much of which we see here, is the
anti-Jupiter hemisphere. Io has more than 100 active volcanoes spewing very hot
lava and giant plumes of gas and dust. Its biggest plume, Pele, is near the
bottom left edge of Io's disk as seen here. Cassini is a cooperative project of
NASA, the European Space Agency and the Italian Space Agency. The Jet Propulsion
Laboratory, a division of the California Institute of Technology in Pasadena,
manages the Cassini mission for NASA's Office of Space Science, Washington, D.C.
*Image Credit*: NASA/JPL/University of Arizona
Huge cyclonic storms, the Great Red Spot and the Little Red Spot, and wispy
cloud patterns are seen in fascinating detail in this map of Jupiter's
atmosphere obtained January 14-15, 2007, by the New Horizons Long Range
Reconnaissance Imager (LORRI). The map combines information from 11 different
LORRI images that were taken every hour over a 10-hour period -- a full Jovian
day -- from 17:42 UTC on January 14 to 03:42 UTC on January 15. The New Horizons
spacecraft was approximately 72 million kilometers (45 million miles) from
Jupiter at the time. The LORRI pixels on the "globe" of Jupiter were projected
onto a rectilinear grid, similar to the way flat maps of Earth are created. The
LORRI pixel intensities were corrected so that every point on the map appears as
if the sun were directly overhead; some image sharpening was also applied to
enhance detail. The polar regions of Jupiter are not shown on the map because
the LORRI images do not sample those latitudes very well and artifacts are
produced during the map-projection process.
This dramatic view of Jupiter's Great Red Spot and its surroundings was obtained
by Voyager 1 on Feb. 25, 1979, when the spacecraft was 5.7 million miles (9.2
million kilometers) from Jupiter. Cloud details as small as 100 miles (160
kilometers) across can be seen here. The colorful, wavy cloud pattern to the
left of the Red Spot is a region of extraordinarily complex end variable wave
motion. The Jet Propulsion Laboratory manages the Voyager mission for NASA's
Office of Space Science.
Scientists have spotted what appear to be thunderheads on Jupiter bright white
cumulus clouds similar to those that bring thunderstorms on Earth - at the outer
edges of Jupiter's Great Red Spot. Images from NASA's Galileo spacecraft now in
orbit around Jupiter are providing new evidence that thunderstorms may be an
important source of energy for Jupiter's winds that blow at more than 500
kilometers per hour (about 300 miles per hour). The photos were taken by
Galileo's solid state imager camera on June 26, 1996 at a range of about 1.4
million kilometers (about 860,000 miles). The image at top is a mosaic of
multiple images taken through near-infrared filters. False coloring in the image
reveals cloud-top heights. High, thick clouds are white and high, thin clouds
are pink. Low-altitude clouds are blue. The two black-and-white images at bottom
are enlargements of the boxed area; the one on the right was taken 70 minutes
after the image on the left. The arrows show where clouds have formed or
dissipated in the short time between the images. The smallest clouds are tens of
kilometers across. On Earth, moist convection in thunderstorms is a pathway
through which solar energy, deposited at the surface, is transported and
delivered to the atmosphere. Scientists at the California Institute of
Technology analyzing data from Galileo believe that water, the most likely
candidate for what composes these clouds on Jupiter, may be more abundant at the
site seen here than at the Galileo Probe entry site, which was found to be
unexpectedly dry. The Galileo mission is managed by the Jet Propulsion
Laboratory for NASA's Office of Space Science, Washington, D.C. . This image and
other images and data received from Galileo are posted on the Galileo mission
home page on the World Wide Web at http://galileo.jpl.nasa.gov. Background
information and educational context for the images can be found at
http://www.jpl.nasa.gov/galileo/sepo
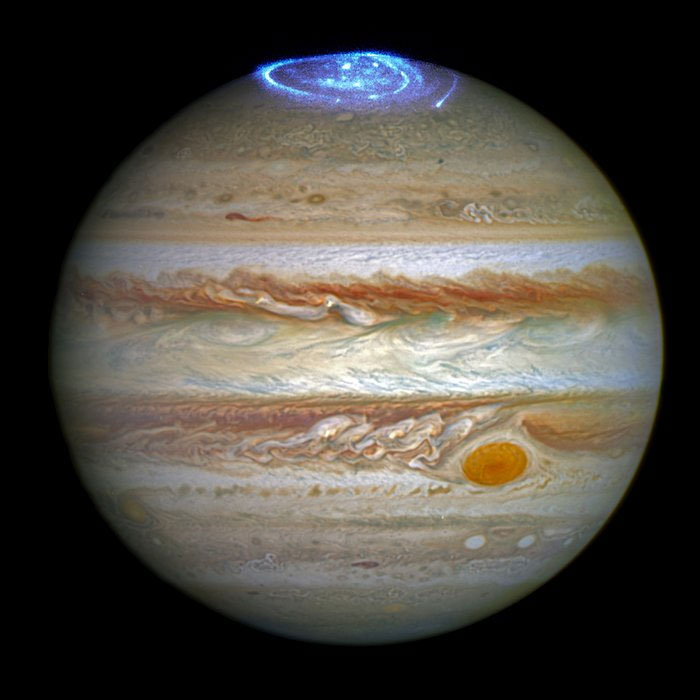
*Description*: NASA's Hubble Space Telescope is following dramatic and rapid
changes in Jupiter's turbulent atmosphere that will be critical for targeting
observations made by the Galileo space probe when it arrives at the giant planet
later this year. This Hubble image provides a detailed look at a unique cluster
of three white oval-shaped storms that lie southwest (below and to the left) of
Jupiter's Great Red Spot. The appearance of the clouds, as imaged on February
13, 1995 is considerably different from their appearance only seven months
earlier. Hubble shows these features moving closer together as the Great Red
Spot is carried westward by the prevailing winds while the white ovals are swept
eastward. (This change in appearance is not an effect of last July's comet
Shoemaker- Levy 9 collisions with Jupiter.) The outer two of the white storms
formed in the late 1930s. In the centers of these cloud systems the air is
rising, carrying fresh ammonia gas upward. New, white ice crystals form when the
upwelling gas freezes as it reaches the chilly cloud top level where
temperatures are -200 degrees Fahrenheit (-130 degrees Centigrade). The
intervening white storm center, the ropy structure to the left of the ovals, and
the small brown spot have formed in low pressure cells. The white clouds sit
above locations where gas is descending to lower, warmer regions. The extent of
melting of the white ice exposes varied amounts of Jupiter's ubiquitous brown
haze. The stronger the down flow, the less ice, and the browner the region. A
scheduled series of Hubble observations will help target regions of interest for
detailed scrutiny by the Galileo spacecraft, which will arrive at Jupiter in
early December 1995. Hubble will provide a global view of Jupiter while Galileo
will obtain close-up images of structure of the clouds that make up the large
storm systems such as the Great Red Spot and white ovals that are seen in this
picture. This color picture is assembled from a series of images taken by the
Wide Field Planetary Camera 2, in planetary camera mode, when Jupiter was at a
distance of 519 million miles (961 million kilometers) from Earth. These images
are part of a set of data obtained by a Hubble Space Telescope (HST) team headed
by Reta Beebe of New Mexico State University. Technical facts about this news
release: About the Object Object Name: Jupiter Object Description: Planet
Diameter: The planet has a diameter of roughly 89,000 (143,000 km) at the
equator. Average Distance The semi-major axis of Jupiter's orbit about the Sun
is 5.2 astronomical units or roughly 483 million miles (778 million km). About
the Data Instrument: WFPC2 Exposure Date(s): February 13, 17, 18, 1995 Exposure
Time: 55 minutes Filters: F410N (StrÔø_Ôø_Ôø_mgren v), F555W ("V"), F673N ([S II])
Principal Astronomers: R. Beebe and A. Simon (NMSU), G. Orton (JPL), P. Gierasch
(Cornell University), K. Rages (NASA Ames Research Center), A. Ingersoll (Caltech),
J. Pollack (NASA Ames Research Center), C. Cunningham (ISTS), M Belton (NOAO).
About the Image Image Credit: NASA, R. Beebe, and A. Simon (NMSU) Release Date:
March 31, 1995 *News Release Number:*: STScI-1995-18a
Publication date 11/7/2004
Topics What -- Jupiter, What -- FAST, What -- Earth, What -- Cassini, What --
Sun, Where -- Jet Propulsion Laboratory (JPL), Where -- Washington, Where --
California
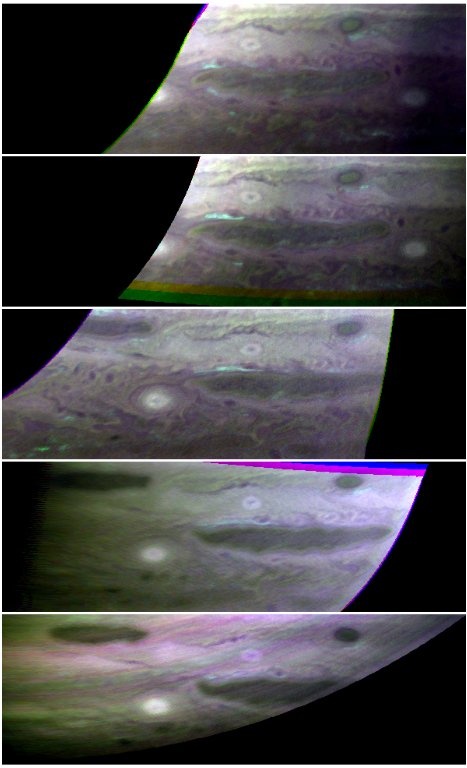
This sequence of nine true-color, narrow-angle images shows the varying
appearance of Jupiter as it rotated through more than a complete 360-degree
turn. The smallest features seen in this sequence are no bigger than about 380
kilometers (about 236 miles). Rotating more than twice as fast as Earth, Jupiter
completes one rotation in about 10 hours. These images were taken on Oct. 22 and
23, 2000. From image to image (proceeding left to right across each row and then
down to the next row), cloud features on Jupiter move from left to right before
disappearing over the edge onto the nightside of the planet. The most obvious
Jovian feature is the Great Red Spot, which can be seen moving onto the dayside
in the third frame (below and to the left of the center of the planet). In the
fourth frame, taken about 1 hour and 40 minutes later, the Great Red Spot has
been carried by the planet's rotation to the east and does not appear again
until the final frame, which was taken one complete rotation after the third
frame. Unlike weather systems on Earth, which change markedly from day to day,
large cloud systems in Jupiter's colder, thicker atmosphere are long-lived, so
the two frames taken one rotation apart have a very similar appearance. However,
when this sequence of images is eventually animated, strong winds blowing
eastward at some latitudes and westward at other latitudes will be readily
apparent. The results of such differential motions can be seen even in the still
frames shown here. For example, the clouds of the Great Red Spot rotate
counterclockwise. The strong westward winds northeast of the Great Red Spot are
deflected around the spot and form a wake of turbulent clouds downstream (visible
in the fourth image), just as a rock in a rapidly flowing river deflects the
fluid around it. The equatorial zone on Jupiter is currently bright white,
indicating the presence of clouds much like cirrus clouds on Earth, but made of
ammonia instead of water ice. This is very different from Jupiter's appearance
20 years ago, when the equatorial zone was more of a brownish cast similar to
the region just to its north. At the northern edge of the equatorial zone, local
regions colored a dark grayish-blue are places where the ammonia clouds have
cleared allowing a view to deeper levels in Jupiter's atmosphere. Interrupting
these relatively clear regions is a series of bright arrow-shaped equatorial
plumes. The most obvious one is visible just above and to the right of center in
the third and ninth frames. These plumes resemble the "anvil' clouds that
accompany common summer thunderstorms on Earth, although the Jovian plumes are
much bigger, and their somewhat regular spacing around the planet suggests an
association with a planetary-scale wave motion. The southwest-northeast tilt of
these plumes suggests that the winds in this region act to help maintain the
eastward winds at this latitude. In the dark belt north of the equatorial zone,
a turbulent region with a white filamentary cloud is visible in the sixth frame,
indicating rapidly changing wind direction. Several white ovals are visible at
higher southern latitudes (toward the bottom of the fourth, fifth, and sixth
frames, for example). These ovals, like the Great Red Spot, rotate
counterclockwise and are similar in some respects to high-pressure systems on
Earth. When these images were taken, Cassini was about 3.3 degrees above
Jupiter's equatorial plane, and the Sun-Jupiter-spacecraft angle was about 20
degrees. JPL manages the Cassini mission for NASA's Office of Space Science,
Washington, D.C. JPl is a division of the California Institute of Technology in
Pasadena. The top cloud layer on Jupiter is thought to consist of ammonia ice,
but most of that ammonia "hides" from spectrometers. It does not absorb light in
the same way ammonia does. To many scientists, this implies that ammonia churned
up from lower layers of the atmosphere "ages" in some way after it condenses,
possibly by being covered with a photochemically generated hydrocarbon mixture.
The New Horizons Linear Etalon Imaging Spectral Array (LEISA), the half of the
Ralph instrument that is able to "see" in infrared wavelengths that are absorbed
by ammonia ice, spotted these clouds and watched them evolve over five Jupiter
days (about 40 Earth hours). In these images, spectroscopically identified fresh
ammonia clouds are shown in bright blue. The largest cloud appeared as a
localized source on day 1, intensified and broadened on day 2, became more
diffuse on days 3 and 4, and disappeared on day 5. The diffusion seemed to
follow the movement of a dark spot along the boundary of the oval region.
Because the source of this ammonia lies deeper than the cloud, images like these
can tell scientists much about the dynamics and heat conduction in Jupiter's
lower atmosphere.
Io, the most volcanic body in the solar system, is seen in front of Jupiter's
cloudy atmosphere in this image from NASA's Galileo spacecraft, now orbiting the
giant planet. This newly processed image is the best and highest resolution view
of Io produced thus far by Galileo. Galileo was about 487,000 kilometers (about
302,000 miles) from Io when this was taken on September 7, 1996, and Jupiter was
about 908,000 kilometers (about 564,000 miles) away. The image is centered on
the side of Io that always faces away from Jupiter. The color in the image is
composed of data taken in the near-infrared, green and violet filters of
Galileo's solid-state imaging camera, and has been enhanced to emphasize the
extraordinary variations in color and brightness that characterize Io's
volcano-pocked face. The black and bright red materials correspond to the most
recent volcanic deposits, probably no more than a few years old. The
near-infrared filter makes Jupiter's atmosphere look blue. The active volcano
Prometheus is seen near the right-center of the disk. Scientists are noting many
changes that have occurred on Io's surface since the Voyager flybys 17 years
ago, and even a few changes in the two months since Galileo's imaging of Io this
summer. The Jet Propulsion Laboratory, Pasadena, CA, manages the mission for
NASA's Office of Space Science, Washington, DC. This image and other images and
data received from Galileo are posted on the Galileo mission home page on the
World Wide Web at http://galileo.jpl.nasa.gov. Background information and
educational context for the images can be found at http://
www.jpl.nasa.gov/galileo/sepo
These four images of clouds in a portion of Jupiter's southern hemisphere show
steps in the consolidation of three "white oval" storms into one over a
three-year span of time. They were obtained on four dates, from Sept. 18, 1997,
to Sept. 2, 2000, by NASA's Hubble Space Telescope. The widths of the white
ovals range from about 8,000 kilometers to 12,000 kilometers (about 5,000 miles
to 7,500 miles). North is up and east is to the right. The top image shows three
white oval storms, which had coexisted for about 60 years. They were nicknamed
FA, DE and BC, in order from west to east. By mid-1998, as shown in the second
image, the two easternmost storms had merged into one, called BE. By October
1999, as shown in the third image, the merged oval and the last of the original
three were approaching each other, but they were separated by a dark storm,
called o 1, between them. The two white oval storms later merged into a single
storm, as shown in the final image from September 2000. The Hubble Space
Telescope is a facility of NASA and the European Space Agency. It is operated by
the Space Telescope Science Institute, Baltimore, Md., which is managed for NASA
by the Association of Universities for Research in Astronomy in Honolulu.
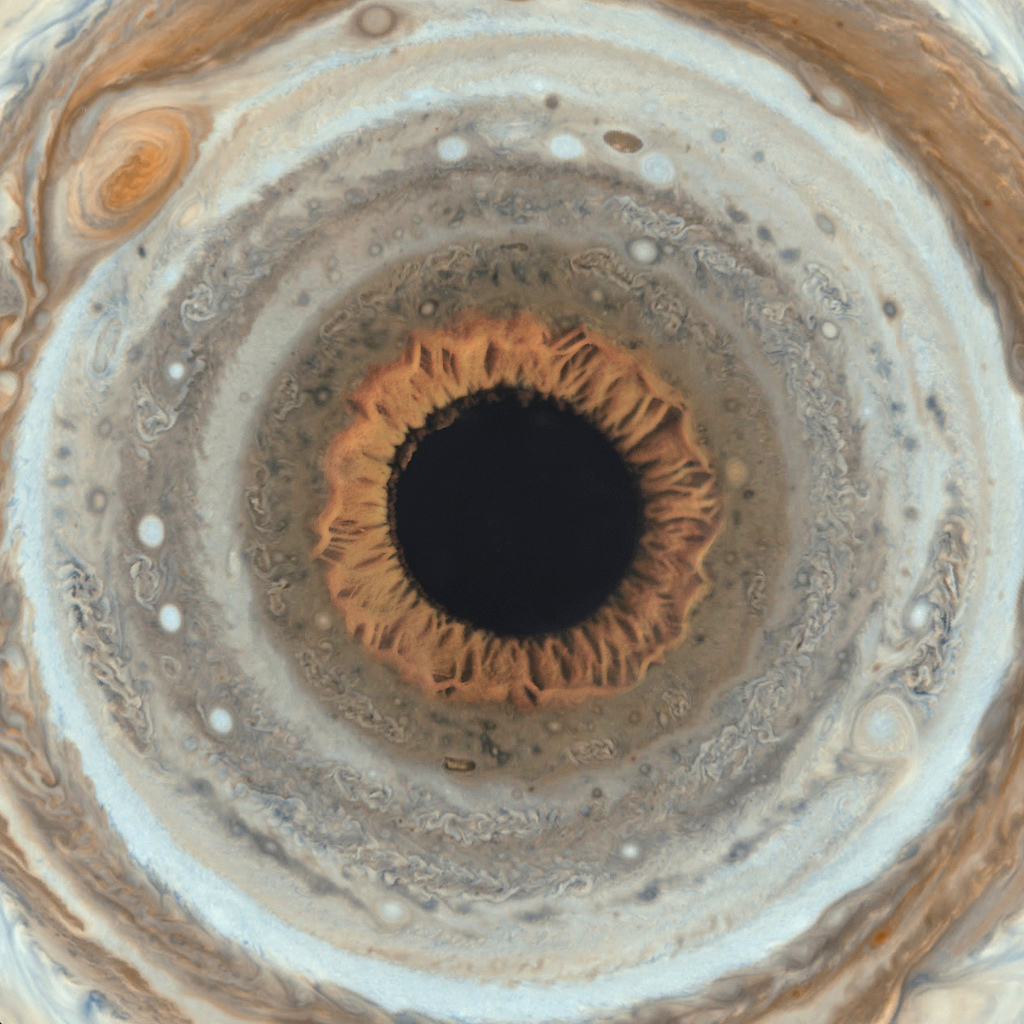
This map is part of a group release of cylindrical and polar stereographic
projections of Jupiter. For the other maps see <a href="http://photojournal.jpl.nasa.gov/catalog/PIA07783">PIA07783</a>
and <a href="http://photojournal.jpl.nasa.gov/catalog/PIA07784">PIA07784</a>.
These color maps of Jupiter were constructed from images taken by the
narrow-angle camera onboard NASA's Cassini spacecraft on Dec. 11 and 12, 2000,
as the spacecraft neared Jupiter during its flyby of the giant planet. Cassini
was on its way to Saturn. They are the most detailed global color maps of
Jupiter ever produced. The smallest visible features are about 120 kilometers
(75 miles) across. The maps are composed of 36 images: a pair of images covering
Jupiter's northern and southern hemispheres was acquired in two colors every
hour for nine hours as Jupiter rotated beneath the spacecraft. Although the raw
images are in just two colors, 750 nanometers (near-infrared) and 451 nanometers
(blue), the map's colors are close to those the human eye would see when gazing
at Jupiter. The maps show a variety of colorful cloud features, including
parallel reddish-brown and white bands, the Great Red Spot, multi-lobed chaotic
regions, white ovals and many small vortices. Many clouds appear in streaks and
waves due to continual stretching and folding by Jupiter's winds and turbulence.
The bluish-gray features along the north edge of the central bright band are
equatorial "hot spots," meteorological systems such as the one entered by NASA's
Galileo probe. Small bright spots within the orange band north of the equator
are lightning-bearing thunderstorms. The polar regions are less clearly visible
because Cassini viewed them at an angle and through thicker atmospheric haze (such
as the whitish material in the south polar map -- see <a href="http://photojournal.jpl.nasa.gov/catalog/PIA07784">PIA07784</a>.
Pixels in the rectangular map cover equal increments of planetocentric latitude
(which is measured relative to the center of the planet) and longitude, and
extend to 180 degrees of latitude and 360 degrees of longitude. The
Cassini-Huygens mission is a cooperative project of NASA, the European Space
Agency and the Italian Space Agency. The Jet Propulsion Laboratory, a division
of the California Institute of Technology in Pasadena, manages the mission for
NASA's Science Mission Directorate, Washington, D.C. The Cassini orbiter and its
two onboard cameras were designed, developed and assembled at JPL. The imaging
operations center is based at the Space Science Institute in Boulder, Colo. For
more information about the Cassini-Huygens mission visit <a href="http://saturn.jpl.nasa.gov">http://saturn.jpl.nasa.gov/home/index.cfm</a>.
The Cassini imaging team homepage is at <a href="http://ciclops.org">http://ciclops.org</a>.
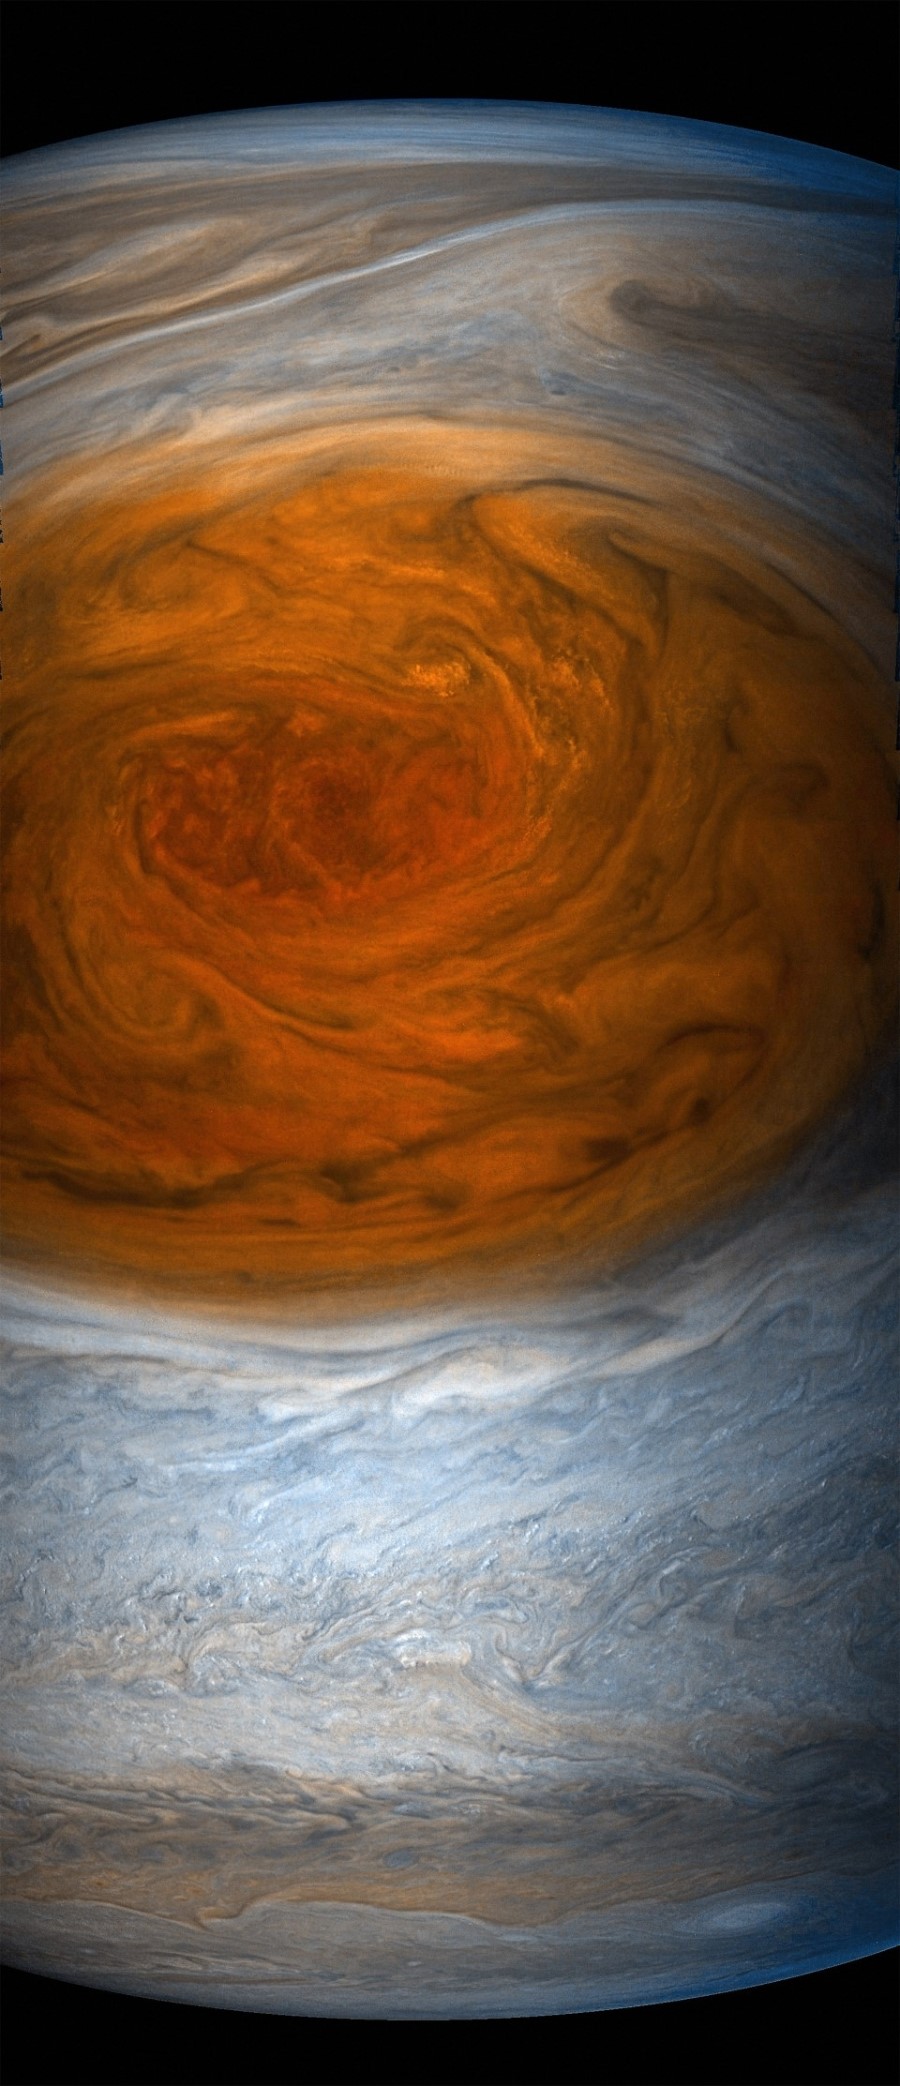
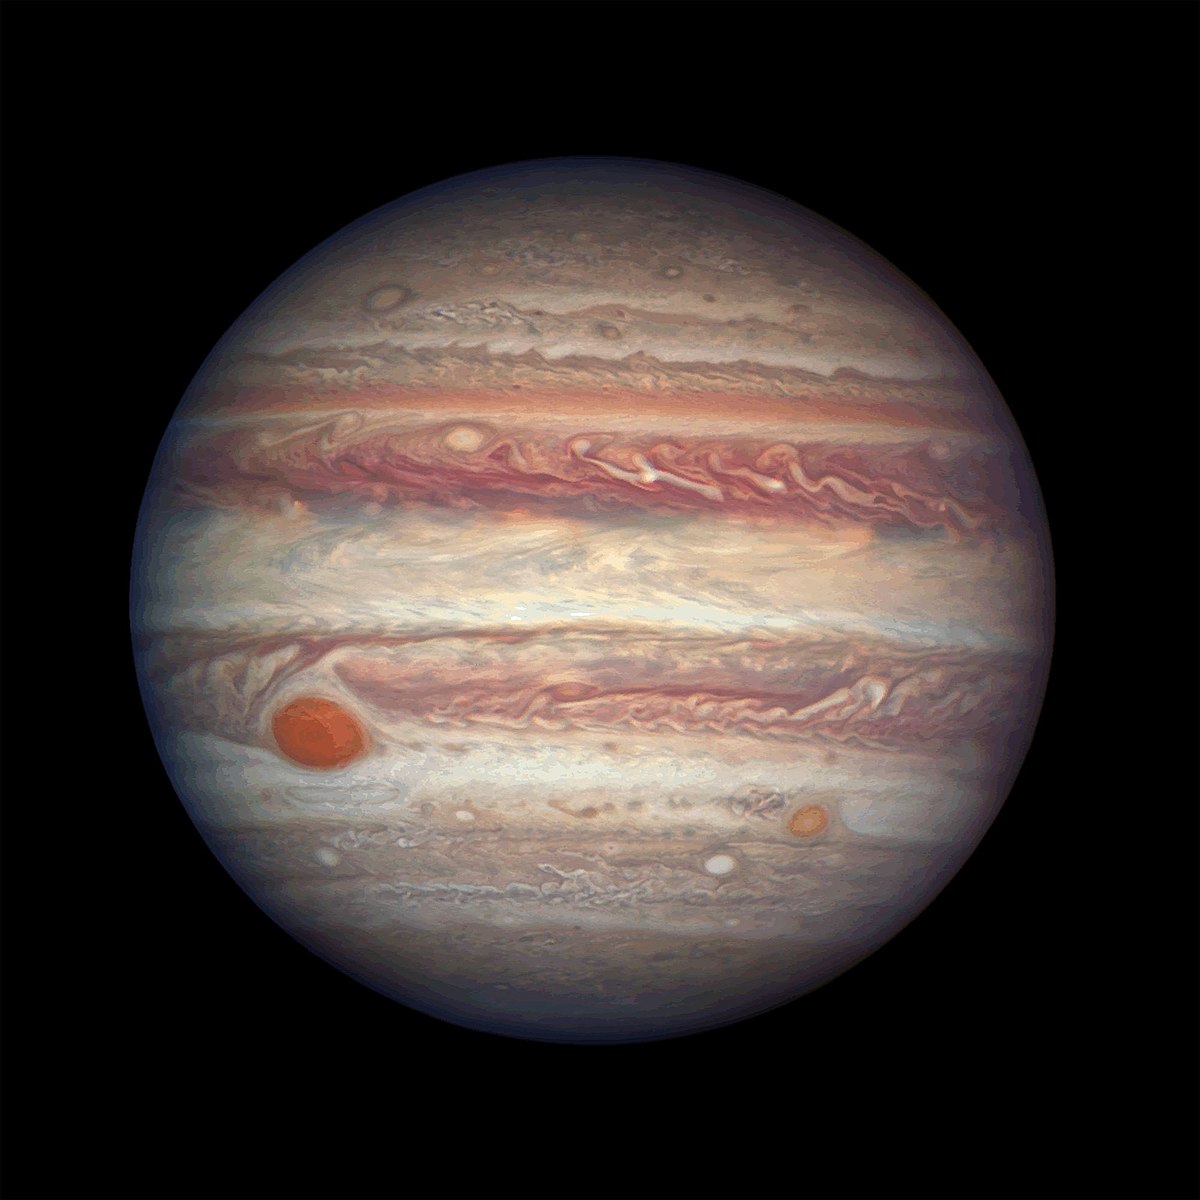
When 17th-century astronomers first turned their telescopes to Jupiter, they
noted a conspicuous reddish spot on the giant planet. This Great Red Spot is
still present in Jupiter's atmosphere, more than 300 years later. It is now
known that it is a vast storm, spinning like a cyclone. Unlike a low-pressure
hurricane in the Caribbean Sea, however, the Red Spot rotates in a
counterclockwise direction in the southern hemisphere, showing that it is a
high-pressure system. Winds inside this Jovian storm reach speeds of about 270
mph. The Red Spot is the largest known storm in the Solar System. With a
diameter of 15,400 miles, it is almost twice the size of the entire Earth and
one-sixth the diameter of Jupiter itself. The long lifetime of the Red Spot may
be due to the fact that Jupiter is mainly a gaseous planet. It possibly has
liquid layers, but lacks a solid surface, which would dissipate the storm's
energy, much as happens when a hurricane makes landfall on the Earth. However,
the Red Spot does change its shape, size, and color, sometimes dramatically.
Such changes are demonstrated in high-resolution Wide Field and Planetary
Cameras 1 & 2 images of Jupiter obtained by NASA's Hubble Space Telescope, and
presented here by the Hubble Heritage Project team. The mosaic presents a series
of pictures of the Red Spot obtained by Hubble between 1992 and 1999 (see
PIA01594 thru PIA01599 and PIA02400 thru PIA02402 for individual images).
Astronomers study weather phenomena on other planets in order to gain a greater
understanding of our own Earth's climate. Lacking a solid surface, Jupiter
provides us with a laboratory experiment for observing weather phenomena under
very different conditions than those prevailing on Earth. This knowledge can
also be applied to places in the Earth's atmosphere that are over deep oceans,
making them more similar to Jupiter's deep atmosphere.
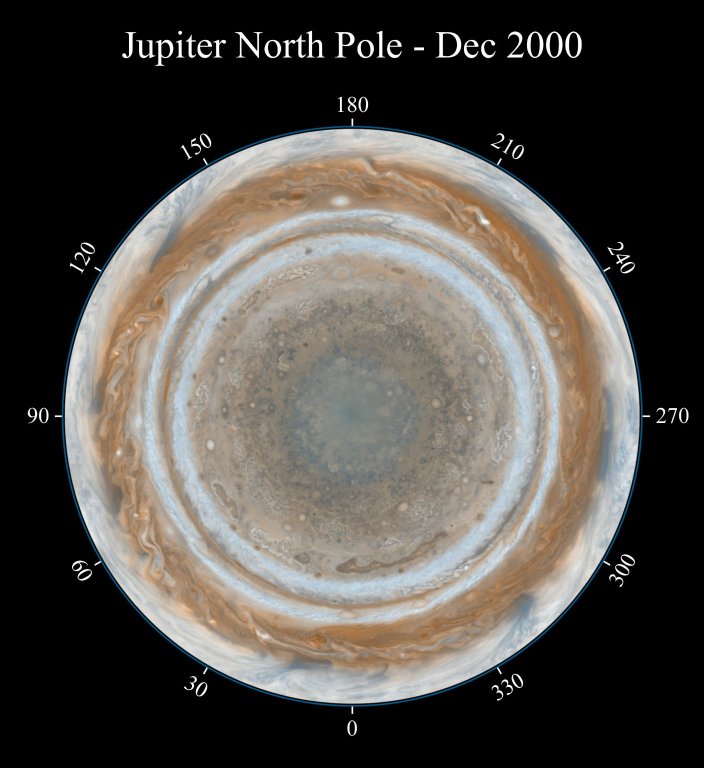
These color maps of Jupiter were constructed from images taken by the
narrow-angle camera onboard NASA's Cassini spacecraft on Dec. 11 and 12, 2000,
as the spacecraft neared Jupiter during its flyby of the giant planet. Cassini
was on its way to Saturn. They are the most detailed global color maps of
Jupiter ever produced; the smallest visible features are about 120 kilometers
(75 miles) across. For other maps see <a href="http://photojournal.jpl.nasa.gov/catalog/PIA07782">PIA07782</a>
and <a href="http://photojournal.jpl.nasa.gov/catalog/PIA07783">PIA07783</a>.
The maps are composed of 36 images: a pair of images covering Jupiter's northern
and southern hemispheres was acquired in two colors every hour for nine hours as
Jupiter rotated beneath the spacecraft. Although the raw images are in just two
colors, 750 nanometers (near-infrared) and 451 nanometers (blue), the map's
colors are close to those the human eye would see when gazing at Jupiter. The
maps show a variety of colorful cloud features, including parallel reddish-brown
and white bands, the Great Red Spot, multi-lobed chaotic regions, white ovals
and many small vortices. Many clouds appear in streaks and waves due to
continual stretching and folding by Jupiter's winds and turbulence. The
bluish-gray features along the north edge of the central bright band are
equatorial "hot spots," meteorological systems such as the one entered by NASA's
Galileo probe. Small bright spots within the orange band north of the equator
are lightning-bearing thunderstorms. The polar regions shown here are less
clearly visible because Cassini viewed them at an angle and through thicker
atmospheric haze. The round maps are polar stereographic projections that show
the north or south pole in the center of the map and the equator at the edge.
The Cassini-Huygens mission is a cooperative project of NASA, the European Space
Agency and the Italian Space Agency. The Jet Propulsion Laboratory, a division
of the California Institute of Technology in Pasadena, manages the mission for
NASA's Science Mission Directorate, Washington, D.C. The Cassini orbiter and its
two onboard cameras were designed, developed and assembled at JPL. The imaging
operations center is based at the Space Science Institute in Boulder, Colo. For
more information about the Cassini-Huygens mission visit <a
href="http://saturn.jpl.nasa.gov">http://saturn.jpl.nasa.gov/home/index.cfm</a>.
The Cassini imaging team homepage is at <a
href="http://ciclops.org">http://ciclops.org</a>.
This map is part of a group release of cylindrical and polar stereographic
projections of Jupiter. For the other maps see <a
href="http://photojournal.jpl.nasa.gov/catalog/PIA07782">PIA07782</a> and <a
href="http://photojournal.jpl.nasa.gov/catalog/PIA07784">PIA07784</a>. These
color maps of Jupiter were constructed from images taken by the narrow-angle
camera onboard NASA's Cassini spacecraft on Dec. 11 and 12, 2000, as the
spacecraft neared Jupiter during its flyby of the giant planet. Cassini was on
its way to Saturn. They are the most detailed global color maps of Jupiter ever
produced. The smallest visible features are about 120 kilometers (75 miles)
across. The maps are composed of 36 images: a pair of images covering Jupiter's
northern and southern hemispheres was acquired in two colors every hour for nine
hours as Jupiter rotated beneath the spacecraft. Although the raw images are in
just two colors, 750 nanometers (near-infrared) and 451 nanometers (blue), the
map's colors are close to those the human eye would see when gazing at Jupiter.
The maps show a variety of colorful cloud features, including parallel
reddish-brown and white bands, the Great Red Spot, multi-lobed chaotic regions,
white ovals and many small vortices. Many clouds appear in streaks and waves due
to continual stretching and folding by Jupiter's winds and turbulence. The
bluish-gray features along the north edge of the central bright band are
equatorial "hot spots," meteorological systems such as the one entered by NASA's
Galileo probe. Small bright spots within the orange band north of the equator
are lightning-bearing thunderstorms. The polar regions are less clearly visible
because Cassini viewed them at an angle and through thicker atmospheric haze
(such as the whitish material in the south polar map -- see <a
href="http://photojournal.jpl.nasa.gov/catalog/PIA07784">PIA07784</a>. Pixels in
the rectangular map cover equal increments of planetocentric latitude (which is
measured relative to the center of the planet) and longitude, and extend to 180
degrees of latitude and 360 degrees of longitude. The Cassini-Huygens mission is
a cooperative project of NASA, the European Space Agency and the Italian Space
Agency. The Jet Propulsion Laboratory, a division of the California Institute of
Technology in Pasadena, manages the mission for NASA's Science Mission
Directorate, Washington, D.C. The Cassini orbiter and its two onboard cameras
were designed, developed and assembled at JPL. The imaging operations center is
based at the Space Science Institute in Boulder, Colo. For more information
about the Cassini-Huygens mission visit <a
href="http://saturn.jpl.nasa.gov">http://saturn.jpl.nasa.gov/home/index.cfm</a>.
The Cassini imaging team homepage is at <a
href="http://ciclops.org">http://ciclops.org</a>
This map is part of a group release of cylindrical and polar stereographic
projections of Jupiter. For the other maps see <a href="http://photojournal.jpl.nasa.gov/catalog/PIA07782">PIA07782</a>
and <a href="http://photojournal.jpl.nasa.gov/catalog/PIA07784">PIA07784</a>.
These color maps of Jupiter were constructed from images taken by the
narrow-angle camera onboard NASA's Cassini spacecraft on Dec. 11 and 12, 2000,
as the spacecraft neared Jupiter during its flyby of the giant planet. Cassini
was on its way to Saturn. They are the most detailed global color maps of
Jupiter ever produced. The smallest visible features are about 120 kilometers
(75 miles) across. The maps are composed of 36 images: a pair of images covering
Jupiter's northern and southern hemispheres was acquired in two colors every
hour for nine hours as Jupiter rotated beneath the spacecraft. Although the raw
images are in just two colors, 750 nanometers (near-infrared) and 451 nanometers
(blue), the map's colors are close to those the human eye would see when gazing
at Jupiter. The maps show a variety of colorful cloud features, including
parallel reddish-brown and white bands, the Great Red Spot, multi-lobed chaotic
regions, white ovals and many small vortices. Many clouds appear in streaks and
waves due to continual stretching and folding by Jupiter's winds and turbulence.
The bluish-gray features along the north edge of the central bright band are
equatorial "hot spots," meteorological systems such as the one entered by NASA's
Galileo probe. Small bright spots within the orange band north of the equator
are lightning-bearing thunderstorms. The polar regions are less clearly visible
because Cassini viewed them at an angle and through thicker atmospheric haze (such
as the whitish material in the south polar map -- see <a href="http://photojournal.jpl.nasa.gov/catalog/PIA07784">PIA07784</a>.
Pixels in the rectangular map cover equal increments of planetocentric latitude
(which is measured relative to the center of the planet) and longitude, and
extend to 180 degrees of latitude and 360 degrees of longitude. The
Cassini-Huygens mission is a cooperative project of NASA, the European Space
Agency and the Italian Space Agency. The Jet Propulsion Laboratory, a division
of the California Institute of Technology in Pasadena, manages the mission for
NASA's Science Mission Directorate, Washington, D.C. The Cassini orbiter and its
two onboard cameras were designed, developed and assembled at JPL. The imaging
operations center is based at the Space Science Institute in Boulder, Colo. For
more information about the Cassini-Huygens mission visit <a href="http://saturn.jpl.nasa.gov">http://saturn.jpl.nasa.gov/home/index.cfm</a>.
The Cassini imaging team homepage is at <a href="http://ciclops.org">http://ciclops.org</a>.
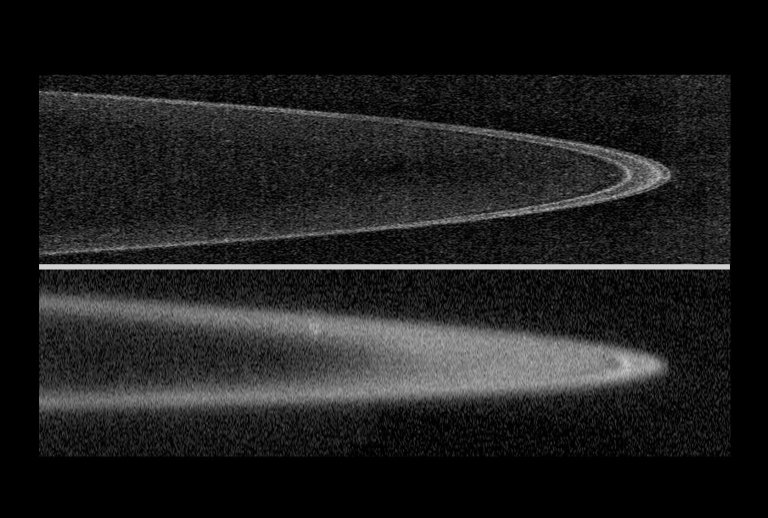
The New Horizons spacecraft took the best images of Jupiter's charcoal-black
rings as it approached and then looked back at Jupiter. The top image was taken
on approach, showing three well-defined lanes of gravel- to boulder-sized
material composing the bulk of the rings, as well as lesser amounts of material
between the rings. New Horizons snapped the lower image after it had passed
Jupiter on February 28, 2007, and looked back in a direction toward the sun. The
image is sharply focused, though it appears fuzzy due to the cloud of dust-sized
particles enveloping the rings. The dust is brightly illuminated in the same way
the dust on a dirty windshield lights up when you drive toward a "low" sun. The
narrow rings are confined in their orbits by small "shepherding" moons.
This picture of Europa, a moon of Jupiter, was obtained on February 20, 1997, by
the Solid State Imaging system onboard the Galileo spacecraft during its sixth
orbit around Jupiter. The area is centered at 9.3 degrees north latitude, 275.7
degrees west longitude, on the trailing hemisphere of Europa. As Europa moves in
its orbit around Jupiter, the trailing hemisphere is the portion which is always
on the moon's backside opposite to its direction of motion. The area depicted is
about 32 kilometers by 40 kilometers (20 miles by 25 miles). Resolution is 54
meters (59 yards). The Sun illuminates the scene from the right (east). A
section of a triple band crosses the upper left of the picture and extends for
hundreds of miles across the surface. Triple bands derive their name from their
appearance at lower resolution as a narrow bright band flanked by a pair of
darker bands. At the high resolution of this picture, however, the triple band
is much more complex and is composed of a system of ridges 6 kilometers (4 miles)
across. Some ridges reach heights of about 180 meters (200 yards). Other
features include a hill in the center of the picture about 480 meters (500 yards)
high. Two mounds about 6 kilometers across (4 miles) are seen in the bottom of
the picture. The ridges, hills and mounds probably all represent uplifts of the
icy crust of Europa by processes originating from the interior. The Jet
Propulsion Laboratory, Pasadena, CA, manages the mission for NASA's Office of
Space Science, Washington D.C. This image and other images and data received
from Galileo are posted on the World Wide Web Galileo mission home page at:
http://galileo.jpl.nasa.gov.
This composite includes the four largest moons of Jupiter which are known as the
Galilean satellites. From left to right, the moons shown are Ganymede, Callisto,
Io, and Europa. The Galilean satellites were first seen by the Italian
astronomer Galileo Galilei in 1610. In order of increasing distance from Jupiter,
Io is closest, followed by Europa, Ganymede, and Callisto. The order of these
satellites from the planet Jupiter helps to explain some of the visible
differences among the moons. Io is subject to the strongest tidal stresses from
the massive planet. These stresses generate internal heating which is released
at the surface and makes Io the most volcanically active body in our solar
system. Europa appears to be strongly differentiated with a rock/iron core, an
ice layer at its surface, and the potential for local or global zones of water
between these layers. Tectonic resurfacing brightens terrain on the less active
and partially differentiated moon Ganymede. Callisto, furthest from Jupiter,
appears heavily cratered at low resolutions and shows no evidence of internal
activity. North is to the top of this composite picture in which these
satellites have all been scaled to a common factor of 10 kilometers (6 miles)
per picture element. The Solid State Imaging (CCD) system aboard NASA's Galileo
spacecraft obtained the Io and Ganymede images in June 1996, while the Europa
images were obtained in September 1996. Because Galileo focuses on high
resolution imaging of regional areas on Callisto rather than global coverage,
the portrait of Callisto is from the 1979 flyby of NASA's Voyager spacecraft.
Launched in October 1989, the spacecraft's mission is to conduct detailed
studies of the giant planet, its largest moons and the Jovian magnetic
environment. The Jet Propulsion Laboratory, Pasadena, CA, manages the mission
for NASA's Office of Space Science, Washington, DC. This image and other images
and data received from Galileo are posted on the World Wide Web, on the Galileo
mission home page at: http://galileo.jpl.nasa.gov. Background information and
educational context for the images can be found at: http:/
/www.jpl.nasa.gov/galileo/sepo.
Jupiter's moon Io is the most geologically active body in the solar system today
and provides the most extreme example of the effect of tidal forces. Io is being
pulled by massive Jupiter on one side and by the outer moons (Europa, Callisto,
Ganymede) on the other. The opposing tidal forces alternately squeeze and
stretch its interior, causing the solid surface to rise and fall by about 100
meters. The enormous amount of heat and pressure generated by the resulting
friction creates colossal volcanoes and fractures on the surface of this moon. (Credit:
NASA/USGS) io
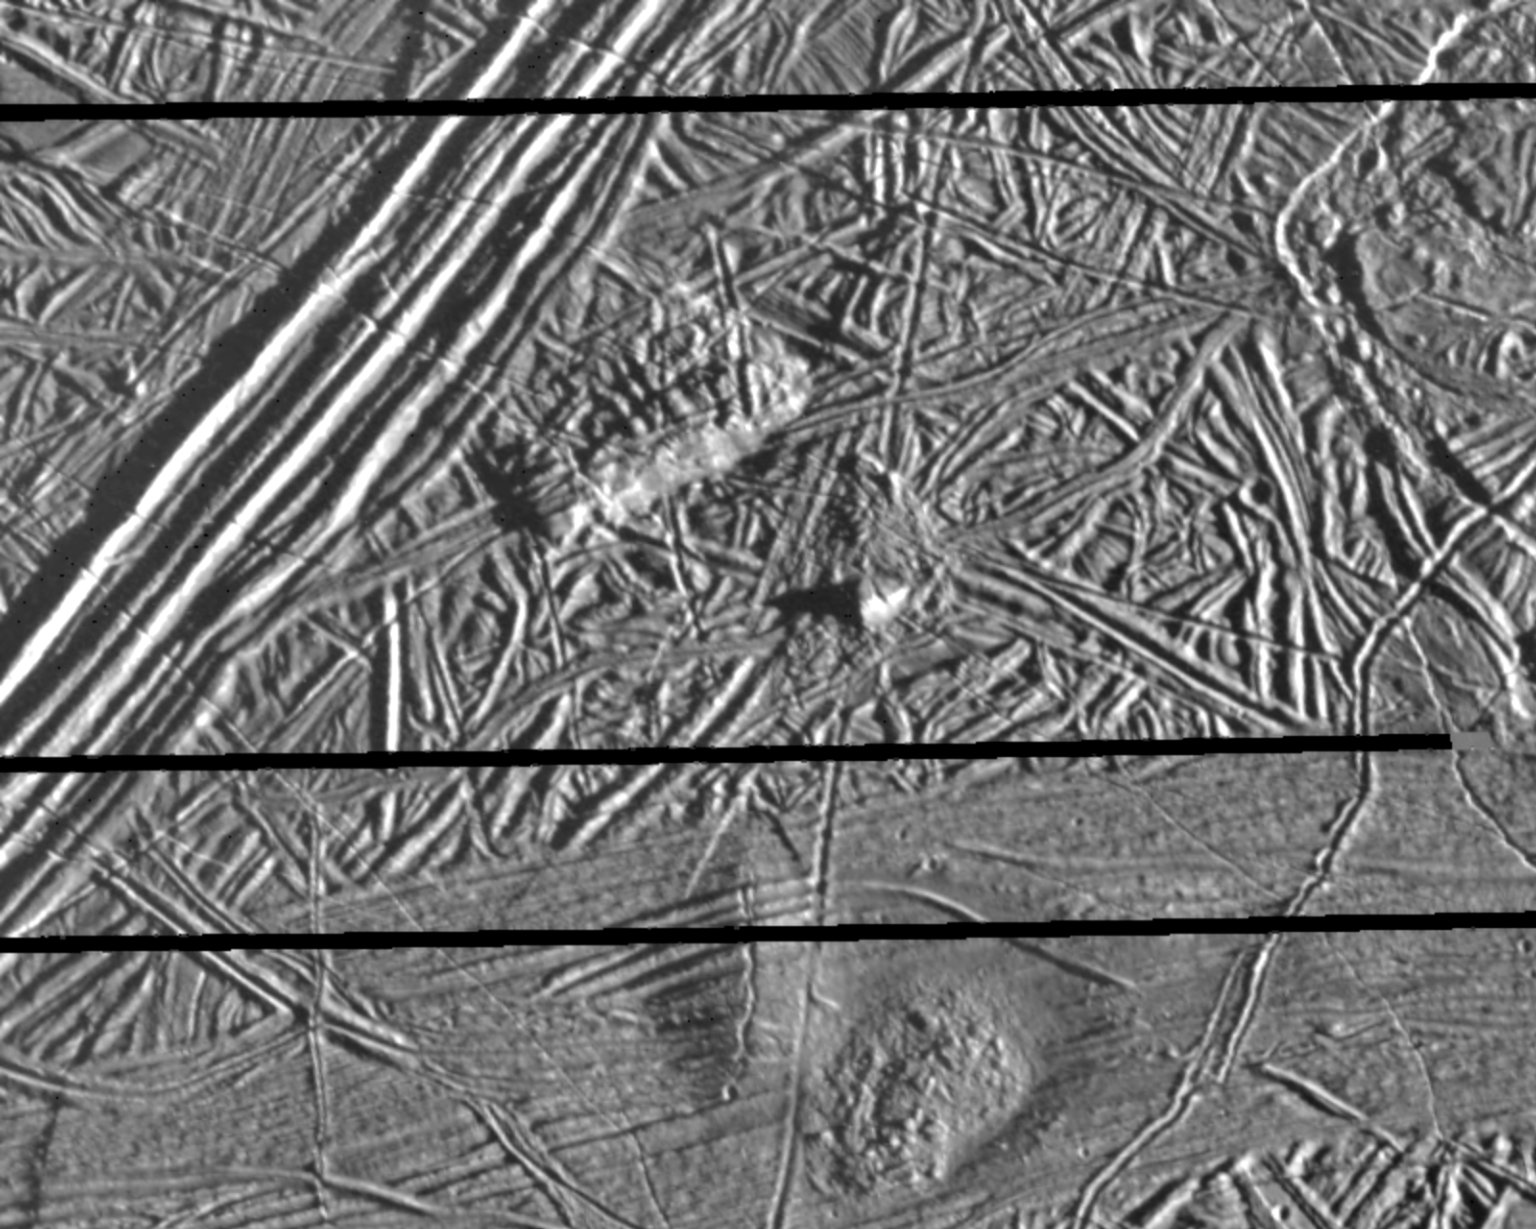
This close-up view of the icy surface of Europa, a moon of Jupiter, was obtained
on December 20, 1996, by the Solid State Imaging system on board the Galileo
spacecraft during its fourth orbit around Jupiter. The view is about 11
kilometers by 16 kilometers (7 miles by 10 miles) and has a resolution of 26
meters (28 yards). The Sun illuminates the scene from the east (right). A flat
smooth area about 3.2 kilometers (2 miles) across is seen in the left part of
the picture. This area resulted from flooding by a fluid which erupted onto the
surface and buried sets of ridges and grooves. The smooth area contrasts with a
distinctly rugged patch of terrain farther east, to the right of the prominent
ridge system running down the middle of the picture. The rugged patch of terrain
is 4 kilometers (2.5 miles) across and represents localized disruption of the
complex network of ridges in the area. Eruptions of material onto the surface,
crustal disruption, and the formation of complex networks of folded and faulted
ridges show that significant energy was available in the interior of Europa.
Although small impact craters are most easily seen in the smooth area, they
occur throughout the ridged terrain seen in this view. The Jet Propulsion
Laboratory, Pasadena, CA, manages the mission for NASA's Office of Space
Science, Washington D.C. This image and other images and data received from
Galileo are posted on the World Wide Web Galileo mission home page at: http://galileo.jpl.nasa.gov.
This image of Europa, an icy satellite of Jupiter about the size of the Earth's
Moon, was obtained from a range of 7415 miles (11933 kilometers) by the Galileo
spacecraft during its fourth orbit around Jupiter and its first close pass of
Europa. The image spans 30 miles by 57 miles (48 km by 91 km) and shows features
as small as 800 feet (240 meters) across. The large circular feature centered in
the upper middle of the image is called a macula, and could be the scar of a
large meteorite impact. The surface of Europa is composed mostly of water ice,
so large impact craters on Europa could look different from large bowl-shaped
depressions formed by impact into rock, such as on the Moon. On Europa's icy
surface, the original impact crater has been modified into a central zone of
rugged topography surrounded by circular fractures which reflect adjustments to
stress in the surrounding icy crust. The Jet Propulsion Laboratory, Pasadena, CA
manages the mission for NASA's Office of Space Science, Washington, DC. This
image and other images and data received from Galileo are posted on the Galileo
mission home page on the World Wide Web at http://galileo.jpl.nasa.gov.
Background information and educational context for the images can be found at
URL http://www.jpl.nasa.gov/galileo/sepo
Photographer : JPL Range : 6.5 million kilometers (4 million miles) Six violet
images of Jupiter makes the mosaic photo, showing the Great Red Spot as a
swirling vortex type motion. This motion is also seen in several nearby white
clouds. These bright white clouds and the Red Spot are rotating in a counter
clockwise direction, except the peculiar filimentary cloud to the right of the
Red Spot is going clockwise. The top of the picture shows the turbulence from
the equatorial jet and more northerly atmospheric currents. The smallest clouds
shown are only 70 miles (120 km) across.
Photographer: Voyage 1 Image of Jupiter and two of its satellites (Io, left, and
Europa). Io is about 350,000 kilometers (220,000 miles) above Jupiter's Great
Red Spot; Europa is about 600,000 kilometers (375,000 miles) above Jupiter's
clouds. Although both satellites have about the same brightness, Io's color is
very different from Europa's. Io's equatorial region show two types of material
-- dark orange, broken by several bright spots -- producing a mottled appearance.
The poles are darker and reddish. Preliminary evidence suggests color variations
within and between the polar regions. Io's surface composition is unknown, but
scientists believe it may be a mixture of salts and sulfur. Erupoa is less
strongly colored, although still relatively dark at short wavelengths. Markings
on Eruopa are less evident that on the other satellites, although this picture
shows darker regions toward the trailing half of the visible disk. Jupiter at
this point is about 20 million kilometers (12.4 million miles) from the
spacecraft. At this resolution (about 400 kimometers or 250 miles) there is
evidence of circular motion in Jupiter's atmosphere. While the dominant
large-scale motions are west-to-east, small-scale movement includes eddy-like
circulation within and between the bands. (JPL ref: P-21082)
Reddish spots and shallow pits pepper the enigmatic ridged surface of Europa in
this view combining information from images taken by NASA's Galileo spacecraft
during two different orbits around Jupiter. The spots and pits visible in this
region of Europa's northern hemisphere are each about 10 kilometers (6 miles)
across. The dark spots are called "lenticulae," the Latin term for freckles.
Their similar sizes and spacing suggest that Europa's icy shell may be churning
away like a lava lamp, with warmer ice moving upward from the bottom of the ice
shell while colder ice near the surface sinks downward. Other evidence has shown
that Europa likely has a deep melted ocean under its icy shell. Ruddy ice
erupting onto the surface to form the lenticulae may hold clues to the
composition of the ocean and to whether it could support life. The image
combines higher-resolution information obtained when Galileo flew near Europa on
May 31, 1998, during the spacecraft's 15th orbit of Jupiter, with
lower-resolution color information obtained on June 28, 1996, during Galileo's
first orbit. The Jet Propulsion Laboratory, a division of the California
Institute of Technology in Pasadena, manages the Galileo mission for NASA's
Office of Space Science, Washington, D.C. Additional information about Galileo
and its discoveries is available on the Galileo mission home page at http://galileo.jpl.nasa.gov
.
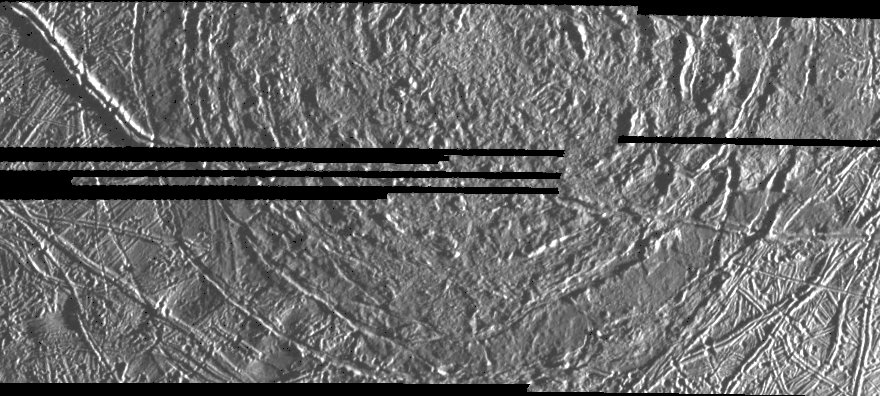
This complex terrain on Jupiter's moon, Europa, shows an area centered at 8
degrees north latitude, 275.4 degrees west longitude, in the trailing hemisphere.
As Europa moves in its orbit around Jupiter, the trailing hemisphere is the
portion which is always on the moon's backside opposite to its direction of
motion. The area shown is about 100 kilometers by 140 kilometers (62 miles by 87
miles). The complex ridge crossing the picture in the upper left corner is part
of a feature that can be traced hundreds of miles across the surface of Europa,
extending beyond the edge of the picture. The upper right part of the picture
shows terrain that has been disrupted by an unknown process, superficially
resembling blocks of sea ice during a springtime thaw. Also visible are
semicircular mounds surrounded by shallow depressions. These might represent the
intrusion of material punching through the surface from below and partial
melting of Europa's icy crust. The resolution of this image is about 180 meters
(200 yards); this means that the smallest visible object is about a quarter of a
mile across. This picture of Europa was taken by Galileo's Solid State Imaging
system from a distance of 17,900 kilometers (11,100 miles) on the spacecraft's
sixth orbit around Jupiter, on February 20, 1997. The Jet Propulsion Laboratory,
Pasadena, CA, manages the mission for NASA's Office of Space Science, Washington
D.C. This image and other images and data received from Galileo are posted on
the World Wide Web Galileo mission home page at http://galileo.jpl.nasa.gov.
This brief movie shows counterclockwise atmospheric motion around Jupiter's
Great Red Spot. The clip was made from blue-filter images taken with the
narrow-angle camera on NASA's Cassini spacecraft during seven separate rotations
of Jupiter between Oct. 1 and Oct. 5, 2000. The clip also shows the eastward and
westward motion of the zonal jets, seen as the horizontal stripes flowing in
opposite directions. The zonal jets circle the planet. As far as can be
determined from both Earth-based and spacecraft measurements, the positions and
speeds of the jets have not changed for 100 years. Since Jupiter is a fluid
planet without a solid boundary, the jet speeds are measured relative to
Jupiter's magnetic field, which rotates, wobbling like a top because of its
tilt, every 9 hours 55.5 minutes. The movie shows motions in the magnetic
reference frame, so winds to the west correspond to features that are rotating a
little slower than the magnetic field, and eastward winds correspond to features
rotating a little faster. Because the Red Spot is in the southern hemisphere,
the direction of motion indicates it is a high-pressure center. Small bright
clouds appear suddenly to the west of the Great Red Spot. Scientists suspect
these small white features are lightning storms. The storms eventually merge
with the Red Spot and surrounding jets, and may be the main energy source for
the large-scale features. The smallest features in the movie are about 500
kilometers (about 300 miles) across. The spacing of the movie frames in time is
not uniform; some consecutive images are separated by two Jupiter rotations, and
some by one. The images have been re-projected using a simple cylindrical map
projection. They show an area from 50 degrees north of Jupiter's equator to 50
degrees south, extending 100 degrees east-west, about one quarter of Jupiter's
circumference. Cassini is a cooperative project of NASA, the European Space
Agency and the Italian Space Agency. The Jet Propulsion Laboratory, a division
of the California Institute of Technology in Pasadena, manages the Cassini
mission for NASA's Office of Space Science, Washington, D.C.
Europa, a moon of Jupiter, appears as a thick crescent in this enhanced-color
image from NASA's Galileo spacecraft, which has been orbiting Jupiter since
1995. The view combines images taken in violet, green and near-infrared filters
in 1998 and 1995. The colors have been stretched to show the subtle differences
in materials that cover the icy surface of Europa. Reddish linear features are
some of the cracks and ridges, thousands of kilometers long, which are caused by
the tides raised by the gravitational pull of Jupiter. Mottled, reddish "chaotic
terrain" exists where the surface has been disrupted and ice blocks have moved
around. The red material at the ridges and chaotic terrain is a non-ice
contaminant and could be salts brought up from a possible ocean beneath Europa's
frozen surface. Also visible are a few circular features, which are small impact
craters. Europa's surface has very few craters, indicating that recent or
current geologic activity has removed the traces of older impacts. The paucity
of craters, coupled with other evidence, has led scientists to surmise that
there could be an ocean of liquid water beneath Europa's surface. Where there is
water, there could be life. This is why Europa is a target of current interest
for study of the possibility of non-Earth life. A follow-up spacecraft to
Galileo will be Europa Orbiter, which should determine whether or not Europa has
an ocean. While at the University of Arizona, Tucson, Dr. Cynthia Phillips used
this image in a detailed search for current geologic activity on Europa.
Phillips is currently with the SETI Institute, Mountain View, Calif. For a study
published in the Journal of Geophysical Research -- Planets last year, she
compared the frames that make up this image with similar images taken in 1979 by
the Voyager spacecraft and found no sign of changes due to geologic activity.
That suggests a minimum surface age for Europa of about 30 million years, though
the result does not rule out current geologic activity altogether, as the study
was limited by the resolution of 2 kilometers (1.6 miles) or more per pixel in
this image and the Voyager images. Future images by Europa Orbiter may allow a
search for smaller-scale changes on Europa's surface. The Jet Propulsion
Laboratory, a division of the California Institute of Technology in Pasadena,
manages the Galileo and Voyager missions for NASA's Office of Space Science,
Washington, D.C. Additional information about Galileo and its discoveries is
available on the Galileo mission home
Public Domain Pictures
DATAMINING RESEARCH for educational purpose only.
The following pictures belong to a geovian satellite: Europa. Look at the texture pattern, and typical lines of this kind of planet. This is a fingerprint that You shall often find in planets of this class.


Following pictures where made during my
sixth voyage, whilst I was wondering about. Here You shall see the same kind of
linear texture, patterns, and even detect maps. I took these pictures from my
first Soulship, called "Conscience 1".
As astronomical pictures of planets, universe and satellites are usually
downgraded, blurred and present artifacts, whenever they aren't totally
renderized or 50 years old at least, then you shall have to work out by yourself
if they are real
or just man made versions or interpretations of photos that are classified. By
reaching far distant worlds through my soul, so, I can now assure You that this
kind of images are real. Depending on your vehicle then you shall be able to
reach,
see, understand, if you manifest yourself in the matter state, or sense,
overlook, know, directly from the conscience level, that is present within our
subtle bodies. If you are not able to understand this concept, then, you are
neither a scientist
nor a dreamer.


Have a nice flyght.
Jedi Simon